
Will KPI Event Contracts Shake Up Earnings Season?

They price the number—not the reaction—so they may not be as useful as you’d hope.

On Friday the SEC published a proposal from NYSE Arca to list binary options on the key performance indicator (KPI) numbers companies report at earnings. Will Apple’s diluted EPS come in above a given level? Will Tesla build more than a given number of Model 3s and Ys? Will Marathon Digital’s mining hashrate clear a threshold? Each contract pays $1 if the reported figure meets or exceeds the strike and nothing if it doesn’t. The list covers 23 companies.

If this sounds familiar, that’s because Cboe filed the same product on June 30. And I do mean the same. NYSE Arca’s filing states that its proposal “is identical to the proposal made by the Cboe.” Everyone appreciates the transparency.

Cboe has been clear about what it thinks these are for. On its July earnings call, its head of derivatives described them as a way “to trade and manage the individual components that drive the company’s stock value. So, for example, think NVIDIA’s data center revenue, think Microsoft’s cloud-based revenue.” The target was an early October launch. The SEC has since given itself until October 13 to act, so that date is slipping.

In August I wrote that I hoped post-earnings price ladders were coming soon: binaries on where a stock finishes its earnings week, so the option chain would finally have a second opinion on the distribution it implies. KPI contracts are a different instrument solving a different problem, and neither one replaces the other.

Trading earnings

When you buy a call into earnings, you’re exposed to two unknowns: the number, and how the stock reacts to the number. Generally speaking, the vast majority of participants really only care about the second part: what will the stock’s price be after the dust settles?

However, EPS and price decouple all the time. Stocks fall on beats every quarter because guidance also plays a really important role in projecting future value. But you can’t really put contracts on guidance. Or at least you shouldn’t for obvious reasons.

The argument for KPI contracts is about moving upstream so you can directly trade the EPS itself as well as the KPIs that ostensibly drive it. It’s the perfect class of instruments for anyone who has ever complained that their modeling was perfect but the stock reacted differently than it should have.

What KPI contracts actually price

Each KPI gets a ladder of strikes above and below a reference level rather than a single yes-or-no, so together they price a whole distribution. If the ladder idea is new to you, the August piece walks through one on a real option chain.

The KPI market list runs at two depths. The headline numbers are there: diluted EPS and revenue for every supported company.

But most of the entries sit a step further upstream, on the things that produce those numbers: data center revenue, iPhone sales, Model 3 and Y production, net interest income, hashrate, and so on. The stock is downstream of EPS, and EPS is downstream of those. So the EPS ladder sharpens your expectation for the number, the operating ladders sharpen where it’s expected to come from, and none of it says a word about what the stock does afterward.

In other words, it’s a market on the number and not on the stock. That distinction does most of the work in what follows.

Who trades these numbers today

Every one of these numbers becomes public in three weeks no matter what, so a forecast of it is only worth something to people who have to act before then. A company that depends on NVIDIA’s shipments doesn’t reprice its business because a ladder moved. It waits for the print like everyone else. The people who act early are the ones holding a position that will reprice on the number.

Those people already trade these figures. They just do it through proxies. If you have a view on iPhone sales today, you express it through Apple stock or options, and the trade carries everything else in Apple along with it, most of all the reaction. A KPI ladder is the direct version of a trade people are already making indirectly.

The sharp end of that crowd has better information than a view. There’s an entire industry that exists to forecast exactly these figures: credit card panels for Target’s sales, app usage data for Meta’s daily actives, shipment and customs records for NVIDIA, scraped registration data for Tesla deliveries, supply chain checks on iPhone production. Funds pay real money for it, and today the only way to cash in a good read on iPhone revenue is to buy Apple and hope the stock agrees. A KPI ladder is the first listed instrument where a data edge pays out on the number itself. That’s a genuine customer, well capitalized, and already in the habit.

The operating ladders reach past the company

The EPS and revenue ladders are for people trading the company. The operating ladders are useful to people who aren’t trading it at all, because those numbers decide other companies’ quarters, and those other stocks reprice on the print too.

Cirrus Logic’s latest 10-K says Apple was about 91% of its net sales. Apple’s KPI list includes iPhone revenue. Apple reports in late October and Cirrus reports a week or so later, on the quarter in which it shipped the parts into those phones. So an iPhone revenue ladder settles days before Cirrus prints, on a number that is very nearly Cirrus’s own quarter in disguise. Nothing listed on Cirrus can express that, and a Cirrus holder has every reason to act before the Apple print.

The bigger version is compute. NVIDIA’s data center revenue is the supply side of AI compute: how many accelerators shipped this quarter. I spent a couple of weeks this summer on the demand side of the same market. The GPU rental ladders on Kalshi price what an hour of H100 or H200 time will cost on a future date. What you can’t get anywhere is the other leg: a tradable view on how much hardware is landing. Put a data center revenue ladder next to the rental ladder and both halves of the compute question have a price. Shipments up and rental prices holding means demand is absorbing supply. Shipments up and rental prices rolling over means the buildout is running ahead of use. Over the summer the H200 rental level held roughly flat while NVIDIA’s data center revenue rose 18% quarter over quarter. One data point, but every neocloud and server builder has a position that reprices on it.

Could a supplier hedge with these? Sort of. The contract settles once a quarter on a threshold rather than a level, in $1 units, and a beat on the number doesn’t stop the supplier’s stock from falling anyway. Hedging is the filing’s justification and I expect it to be the thinnest use. The real use is the one above: a clean place to trade a number that already moves your book.

Why the KPI contract was the easy one to list

Cboe’s CEO said on the same call that “what sets this product apart from competitors is the structure,” and that “these are securities products that should be overseen by the SEC and built within a framework of transparency and investor protection.” The competitors go unnamed. Neither filing mentions prediction markets, the CFTC, or any other venue at all, which for a product that pays $1 on a yes-or-no question is a conspicuous silence. I’ll leave the inference to you.

Whatever the motive, the KPI contract is the easiest binary a securities exchange could list. The settlement value comes out of a document certified by executives and prepared under GAAP, so nobody can bang the close on net interest income and the manipulation section practically writes itself. And it doesn’t sit on top of anything the exchange already lists. A price ladder on Apple would land on the most heavily quoted option surface in the world and either agree with it, which looks redundant, or disagree with it, which looks awkward. An EPS contract can’t embarrass anybody. The filing pitches this as the benefit: today investors “must rely primarily on equity options, whose pricing is affected by a wide range of variables.”

It isn’t that they can’t. Cboe already lists yes-or-no contracts on the Mini-S&P 500, right on top of the index option surface. And single-stock price binaries have a history, if not a happy one: the American Stock Exchange got Fixed Return Options approved in 2007, had to settle them on an all-day average price to keep anyone from leaning on the close, and they never found an audience. The KPI contract avoids all of that. It’s easy to list for the same reason it’s hard to check as a price. Nothing can contradict it, and the filing doesn’t even say what the opening reference level is, since there’s no traded number to anchor to.

Who’s on the other side

This is the part I’d want a newer options trader to think about before the first one lists.

The likeliest seller of your “Apple iPhone revenue above $X” contract isn’t an insider. It’s someone who bought better data than you. That’s legal, it’s what the product is for, and it’s worth knowing before you click. The ladder is where a paid-for read on the number gets monetized, and retail flow that bought because the phone looked popular is the other side of that trade.

Insiders are the second worry. Anyone who knows the number knows the payoff to the penny, and the set of people who know a large company’s production count before the press release isn’t small. The filing says the framework “preserves the integrity of insider trading prohibitions” and that trading will be under exchange and SEC surveillance, and I believe them. But I’ve written before about batting 1.000 on a baseball market, and the lesson there was that spotting informed flow is the easy half.

Then there’s timing. Every one of these expires on the earnings disclosure. But Tesla publishes production and deliveries a couple of days after the quarter ends, about three weeks before it reports, and Marathon posts its bitcoin production monthly. A Tesla production contract would have its answer in the public record for three weeks while it kept trading toward an expiration that’s a formality. That’s not a market so much as a settlement queue, and the filings don’t say how expirations will be timed around it.

Then there’s the market maker. The Cboe filing spends real effort on how a market maker’s quote is protected, and none on how the position behind it gets managed. I think that’s because there’s no good answer. You can’t hedge an EPS contract with the stock when the link between beats and price moves is as loose as it is. A quote that can’t be hedged gets wide, and you pay the width.

One more for the fine print fans: if the company later restates the figure, the settlement stands. You can be right about the real EPS and wrong about the contract.
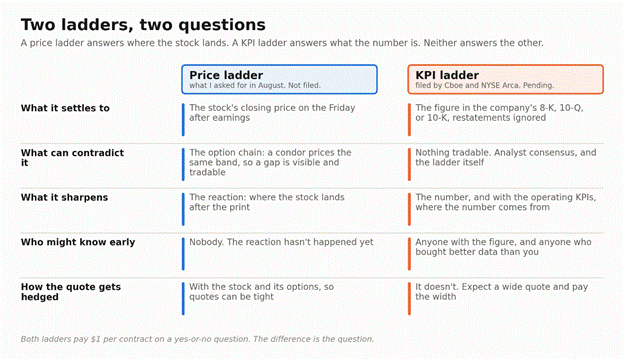
Two ladders, two questions. A price ladder answers where the stock lands and a KPI ladder answers what the number is; neither answers the other.

I still want the ladder

None of this changes what I asked for in August, because it’s a different question. A KPI ladder tells you what the market thinks the number will be, and the operating ladders tell you where it comes from. Neither tells you where the market thinks the stock lands, which is the question most people trading earnings actually have. Only a price ladder answers that with a price the option chain has to reckon with.

And the two together would be more than the sum of the parts. The KPI distribution gives you the number. The price ladder gives you the destination. The gap between them is the market’s view of the reaction, which no instrument expresses today. They answer different questions, and earnings season would be better with both.

Where I land

KPI contracts are going to give the people who already trade these numbers a direct way to do it, and the people best equipped to use them are the ones who paid for the data. None of it is approved yet. The SEC has until October 13 to approve Cboe’s version, reject it, or open proceedings, and it has comments in hand, so keep an eye on that date. Until then, would you trade a contract on a company’s reported EPS? And if you would, who do you think is selling it to you?

Finally, An Instrument Stack Nobody Will Use To Bet On Hockey

Introducing the NHL investment products you never asked for and probably don’t want

Three fund sponsors filed four registration statements in eleven days for exchange-traded funds that track hockey statistics. One of them is leveraged 2x. Nothing underneath them has ever traded, so nobody yet knows whether a single person wants one. Actually, I’ll go out on a limb on that one.

In June I asked who Cboe’s S&P 500 prediction market was actually for. A week later I asked the same question about options on prediction markets and couldn’t find a buyer there either. At this rate I should spin the question off into its own newsletter and give this one back to the markets.

This one actually reminds me of the NFT craze from a few years ago. It seemed silly to many people, and it’s easy to understand why in hindsight. But my view at the time was that it was more of a play by the crypto ecosystem to find absolutely anything people would be willing to buy in their world so they could generate some revenue from their infrastructure investments. There were all kinds of players in this space from exchanges to data publishers to analytics services to first-party IP licensors and more.

I’m not here to litigate NFTs or to remotely suggest there’s anything nefarious about the NHL stack. Everyone in the chain is doing ordinary competent work, and I’ll get to why I think the underlying index is a reasonable piece of engineering. But thirty-two funds for thirty-two teams, one of them leveraged, sitting on an array of futures contracts that have never traded, is the kind of thing I’d rather notice while it’s happening than in the retrospective.

So let’s go through it from the bottom up.

Layer one: the index

Let’s start with the one deterministic thing in the stack, which is what you’d “own” (because it isn’t a team). There’s no equity in the franchise, no ownership, no claim on revenue, no cash flow. It’s a calculated index score based on performance stats.

Every team’s index starts each season at 7,500. The score moves across 55 different statistics as games are played, and resets at the end of each year. The methodology guide’s introduction says the index “quantifies a broad range of statistical performance in a way that is independent from binary win/loss outcomes.” In other words, it’s not even explicitly about winning.

That’s not a criticism. That’s the stated design goal from the administrator’s own opening paragraph, and it tells you plainly what the thing is. It’s a measure of how a team played, not a measure of whether it won. If exposure to whether your team wins is what you came for, the document tries to explain it in its first few lines. And that’s reassuring for all the responsible leveraged ETF investors who never buy in without reading all the prospectuses for the ETF family, any documentation for the futures contracts they rely on, and the specification for the index the futures settle against. We’re all always doing our own research, right?

Anyway, the weights come from what FutureSports calls “scarcity analysis”, which “identifies the relative rarity of specific statistics within the League.” Rarer events are worth more. For example, winning a game is worth a certain number of points whereas a shutout win is worth more.

I want to be explicit that I’m not taking a position on the methodology. Building a single number that summarizes a hockey season is genuinely hard, and every answer you could pick will trigger somebody. The important thing is that FutureSports published a spec and what came out is coherent and does what it says it does. For the record, it also correlates to winning, which is probably more than a coincidence.

Layer two: the futures

CME filed August 11 for permission to list futures on these indexes, with trading set to start September 28. This will enable futures traders to take a variety of positions on any given team’s index at various terms.

One interesting note here is that CME didn’t self-certify, which is the ordinary path and needs only a filing the business day before listing. Instead, it asked the Commission to approve under a rule that runs a 45-day clock expiring around September 25. Under that same rule the product is deemed approved when the clock runs out unless the Commission objects. The default outcome is approval by silence.

Then there’s the sentence the administrator put in its own document, under a heading reading Index Structure, Non-Investability, and Liquidity Considerations:

There is no underlying cash market directly corresponding to the Indexes.

That one matters for anyone who ever trades one of these. A market maker quoting a normal futures contract hedges it in the underlying. Here there isn’t really an underlying. The nearest thing available is a sports betting—I mean event contract—venue like Kalshi, where you can take a position on whether a team wins. Which would be a perfectly good hedge, except for that sentence a few paragraphs up where the administrator explains that the index is independent from win/loss outcomes. The obvious hedge doesn’t work, and it doesn’t work by design.

Layer three: the funds

Volatility Shares filed August 14, Roundhill on August 21, and Hillman Capital twice on August 25, once standard and once leveraged 2x. These ETFs will hold a combination of team futures and Treasurys.

The fee is the number you’d normally pin down before buying. Unfortunately, every filing leaves it blank as far as I’ve found. The sponsor’s own precedent is 2.75% on its existing 2x Bitcoin fund, so let’s use $275 a year on a $10,000 position.

Hold that against what’s in the box. The only part of one of these funds that earns a predictable return is the collateral sitting in Treasury bills. At current front-end yields a fully collateralized $10,000 position earns somewhere around $375. The fee takes most of it before the hockey even starts, and it doesn’t care which team you picked. Best in the league, worst in the league, same $275.

This is all pretty typical and doesn’t disadvantage the investor buying the fund. The one catch is that you’re not exactly exposed to the index, but rather to the basket of futures. And those futures aren’t about the current spot but rather a blended take on the future value. In other words, a team could win, its index could rise, but the futures could crash because a key player gets injured and the fund falls with it.

Another interesting example happens with the offseason when there are no games (and therefore no index movement). Since the funds need to maintain their futures exposure, the prices “may still fluctuate based on market expectations” and the funds “may experience losses during the offseason if market sentiment regarding the team’s upcoming season deteriorates.”

There’s one more critical wrinkle to consider when it comes to these sentiment-driven instruments: they don’t actually track the index until you approach the end of the season. Before then, the pricing would be based on what the market’s expectation is for each team, and that means that you wouldn’t be able to actually buy into a contender like last year’s preseason Carolina Hurricanes at 7,500, but rather closer to 9,200. So when they won the Cup with an index around 11,500, the maximum return would not have been 53% from the 7,500 index they started at, but rather 25% from the 9,200 level they started trading at. It’s still a very good return, but would it be worth the risk of a disappointing season and a marked decline of 27% to the 6,650 average of teams that missed the playoffs?

Note that all the numbers above are rough estimates and calculations based on the spec and aren’t exact or drawn from official sources.

So who is this for?

This was the first question I asked myself when I first saw the ETFs mentioned. It was in an article complaining about how they were bringing gambling to traditional finance, and I thought they were making a good point.

But let’s be clear: nobody is going to gamble on the NHL using these ETFs. Even the 2x leveraged ETF would only move under a percent on a typical win if it tracked the index perfectly, and maybe a couple of percent on a big one. Granted, it could move more or less depending on overall sentiment, but it’s not going to promise the kinds of returns or dopamine hits you could get from a gambling venue.

I’m also pretty sure hedgers will not use these instruments. And I don’t just mean market making hedgers; I also mean the ecosystems that live around the teams themselves, like contract insurers, municipalities, sponsors, etc. The economics just don’t make sense.

I probably don’t have to say that institutional managers won’t use this stack, but I do like the idea of pitching a sector rotation out of power plants and into power plays. Out of blue chips and into blue lines. Out of defense contractors and into defenseman contracts.

I don’t see much opportunity for options traders. There just isn’t enough expected volume or volatility here, and there are thirty-two parallel families as well as futures and multiple ETFs.

This really just leaves the occasional superfan retail investor. Someone who loves the idea of opening their account and seeing the list of teams they’ve bought. Probably next to their NFTs.

The final whistle

Similar to some other questionable instruments, I think this whole stack is an exercise in finding a way to put infrastructure investments to work. I don’t see any real customers and don’t know where the demand is.

What’s striking is that every party in the chain did its job properly. There’s an exclusive league data agreement, an independent administrator with published governance, a listing application at the largest derivatives exchange in the world filed for affirmative approval rather than self-certified, central clearing, and registration statements that would drop these into ordinary brokerage and retirement accounts. Every gate reported success.

Follow the money and you can see why. The league earns a data fee. The administrator earns licensing revenue from the exchange, the sponsors, and data subscriptions. The exchange earns transaction, clearing, and market data fees. The sponsors earn a percentage of assets, across as many chances to gather assets as there are teams. Market makers earn that wide spread. Brokers earn commissions and margin interest (side note: this is not financial advice but please don’t buy NHL ETFs on margin). All ordinary business, conducted normally, and I don’t think anyone involved has behaved badly.

But the holder is the only party whose economics are fully determined in advance, and if I’m honest about what the index looks like from the outside, it reads less like something the market was missing and more like a foundation you can build a lot of products on top of. I’m not going to ask if you’d invest in any of these. I’m not even going to ask if you know anyone who would invest in any of these. But if you do know someone who knows someone who might invest in one of these, then please leave a comment and tag them.

The AI Compute Trading Tools I’m Hoping You’ve Always Wanted

Or you can keep trading GPU contracts like a Neanderthal.

A few weeks ago, I walked through the process of using prediction markets to price a stack of AI compute derivatives. I had just priced a full derivatives stack—a future, a call, a put, and a perpetual—off nothing but the Kalshi H200 binary ladder. There was no Black-Scholes, no volatility input, no anything beyond a bunch of binary probabilities pulled on July 27. Then I wrote: “And the tooling? Well, that’s a tale for another day…”

Today is that day. Or at least a down payment on that day.

If you want to skip the deep dive and just start exploring, you can check it out at https://predictions.qwidgets.com/compute. The platform is free and you don’t even need to register to explore the data.

Also, please keep three things in mind at this stage:

  1. Everything below was captured during drafting on Monday, August 24, 2026. These books roll within days, so read the shapes rather than the decimals.
  2. All of this is shaped around the context of AI compute, but there’s nothing that ties it to that domain. If there are other scenarios with comparable market coverage then extending support is trivial.
  3. These markets have thin liquidity and wide spread bands, so a lot of work had to go into handling scenarios where the data would be incoherent (wide spreads causing higher strikes to be priced higher than lower strikes, etc.) so keep an eye out for notes when the data doesn’t make sense.

Starting at the top

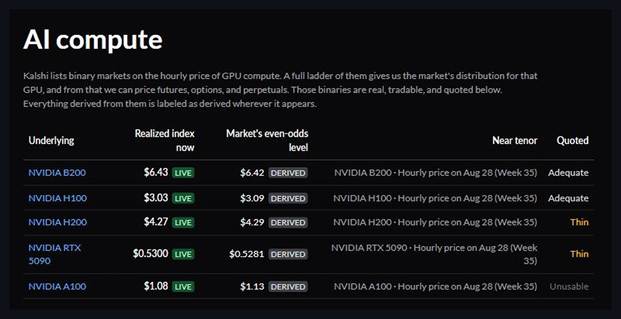
Five GPU underlyings, each with a live realized index from Ornn alongside the level the market prices at even odds.

The AI compute landing page provides a quick glance at the supported GPUs along with index data from Ornn and the even-odds level implied by the Kalshi binaries in the nearest term, which is the current week. This even-odds level is where the 50% crossover is estimated based on the underlying threshold market pricing. The final column provides a rough grade of the quality of our even-odds level based on the confidence we have in that value.

Working the ladder

A threshold market is a literal question: will an H200-hour settle above $4.50? Its price is the answer. Each column lists the odds of clearing every strike level, which is just a literal read of prices off the chain. It’s so vanilla I’m not even going to bother posting a screenshot of the “Chance above” mode. I value your time way too much for that.

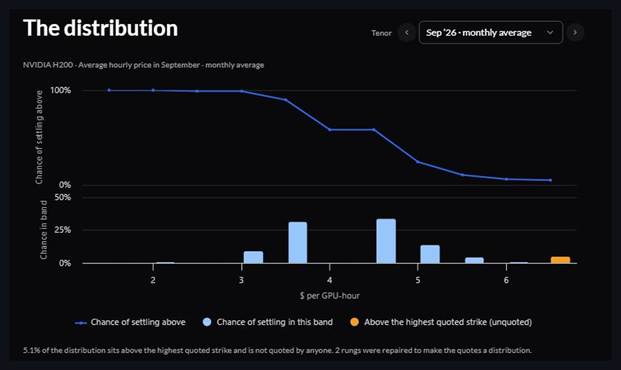
However, there’s a toggle where you can switch to “Chance in band” mode, which is the insight we’re all really looking for. It helps us visualize the distribution the market expects the index to land in on the target date.

The same ladder, shaded by the chance of settling inside each band instead of above each strike. Note the September 2026 column divergence.

The first thing that I noticed when looking at this view is the September 2026 divergence. Roughly a third of the distribution sits in $3.50–4.00 and another third sits in $4.50–5.00, with almost nothing in the band between them. Read literally, the market is saying compute either drifts down or jumps up but is unlikely to sit where it is now.

That would be a genuinely interesting insight and could be a great trade. Or is it misleading? Stay tuned.

Stepping through the tenors

Any single tenor renders as a distribution. The odds of settling above each strike are drawn as a line above and the odds of landing in each band drawn as bars below. The arrows beside the tenor selector step forward and back through every listed settlement, and stepping through them quickly is a great way to see the shape of these distribution expectations evolve over time.

September 2026. The two humps are the split from the matrix, and the flat shelf in the line between $4.00 and $4.50 is the tell.
August 2027, twelve months out. The distribution has gone nearly flat, and the orange bar is 30.6% of the probability sitting above the highest strike anyone quotes.

The near weeks are tight and single-humped. A year out the shape has gone nearly flat, and it’s worth being careful about interpreting what that means. The orange bar is 30.6% of the probability sitting above the highest quoted strike, where there’s no market to read at all. Below it the line is nearly straight, falling about four and a half points per fifty cents from $2.50 all the way to $8.00. The straight line is a uniform distribution, which would put $7.50–8.00 on the same footing as $4.00–4.50 for a chip trading at $4.27. Every rung is two-sided and quoted around six cents wide, so this isn’t neglect. It just isn’t a traded view either.

We’re doing the best we can on the curve

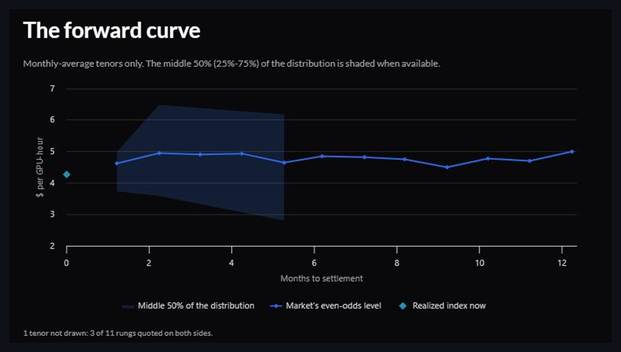
Monthly-average tenors, with the middle 50% of each distribution shaded where the quotes support it.

The line is the same story the earlier article told: roughly flat, no dramatic ramp, sitting a little above the realized index. The width is again the real content. Even after discarding the extreme quarter at each end, the middle half of outcomes spans two to three dollars a few months out. This isn’t particularly useful at the moment but should become better as liquidity grows over time.

The shading runs out around five months because the quotes get too one-sided to bound a middle. Below the chart the app says which tenor it refused to draw and why. For example, when the top threshold market is “Above 6.50” and has over 25% probability, there’s no good way to tell exactly where the top 25% point lands.

Pricing the stack at the money

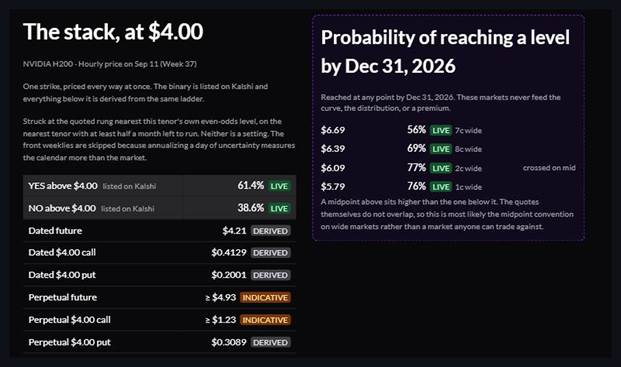
One strike, eight instruments. Only the top two are live on Kalshi. Everything else is derived from the same ladder.

My earlier article required a bunch of work to produce reference prices for these instruments in the closing list. Now they’re generated and refreshed in real time. The YES and NO contracts are live Kalshi markets. The dated future, the call, and the put are model values derived from the ladder. The perpetuals are marked indicative, which is the app saying it will give you a number but wants you to know how much of it is a modelling choice. The prevailing difference between the confidence levels of “derived” and “indicative” comes down to how much we have to account for the unquoted mass of probability above the top threshold market.

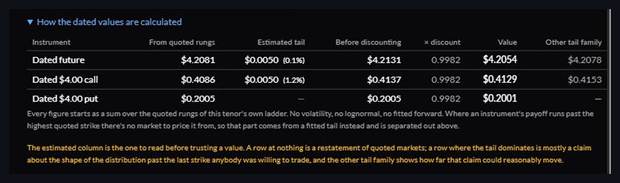
Put-call parity still falls out for free: the $4.00 call at $0.4129 less the put at $0.2001 is $0.2128, against a future of $4.21 less a $4.00 strike. Nobody enforced that. It holds because both figures come from the same distribution.

The derivation, split into the part that comes from quoted markets and the part that comes from a fitted tail.

Every figure is a sum over the quoted rungs. Where an instrument’s payoff runs past the last strike we fit a tail and it shows you how big it is. The dated future shown here is 0.1% estimated tail. The $4.00 call is 1.2%. Both are essentially restatements of quoted markets. A far out-of-the-money call would be mostly tail, and the last column shows how far the number moves under a different tail assumption. This unquoted tail consideration becomes less necessary once we have dated futures trading to produce an independent price to work with.

Chasing the split down

Let’s get back to the discussion of the split forecast for September 2026. Every tenor has its own page, so we can drill in for more detail about what’s going on there.

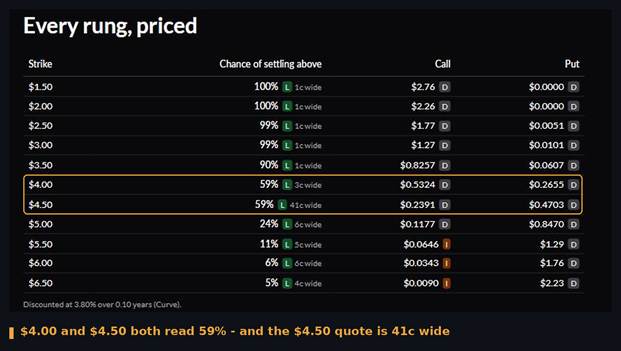
The rung table for September 2026. Two adjacent strikes reading the same probability, one of them quoted 41 cents wide.

The $4.00 and $4.50 rungs both read 59%, and the $4.50 market is quoted 41 cents wide. The note under the distribution says plainly that two rungs were repaired to make the quotes into a coherent distribution: the raw ladder had $4.50 priced above $4.00, which isn’t allowed. Flattening the inversion to produce plausible prices from within their respective bid/ask spreads is what emptied the band between them.

In other words, the bimodal forecast is not really a prevailing forecast. It’s a 41-cent-wide quote on a thinly traded rung, showing up three views later as a shape that looks like conviction. The platform flagged it twice before I got there: once in the width shown on the rung itself, and again in the note under the distribution saying the rungs had been repaired.

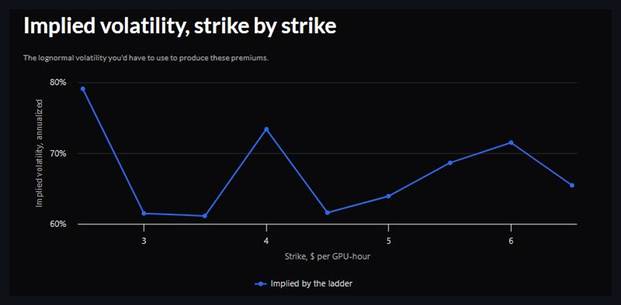
The volatility you would have to assume to produce these option premiums.

Implied volatility is the one number here that runs backwards. Nothing in this pipeline takes volatility as an input. Since the distribution is read straight off the market, this curve is what you get by inverting the premiums and asking what lognormal volatility would have been required to produce them. That makes it a diagnostic rather than a signal, so don’t read too much into it. A strike showing lower or higher implied volatility isn’t a reason to buy or sell that binary. There is no separate volatility surface here to be rich or cheap against. The curve is just another description of the distribution we were already looking at.

Always thinking about perpetuals

The perpetual option was a real pain to price in my earlier article because it needs an assumed anchor tenor. That anchor is a specification rather than a view, and moving it doesn’t refine the price, but rather selects a different contract.

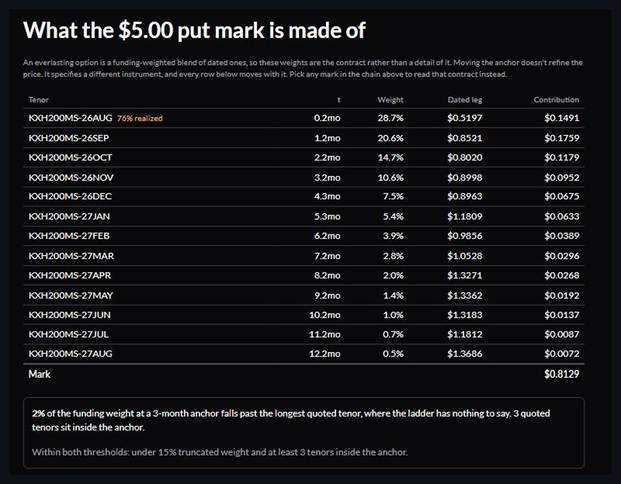
A perpetual mark, decomposed into the dated legs behind it, with the funding weight on each. The box at the bottom is the app checking its own coverage.

I think this is the clearest expression of what an everlasting option actually is. The mark is a funding-weighted blend of dated legs, and those weights are the contract. The bottom box reports how much of the weight falls past the longest quoted tenor and how many quoted tenors sit inside the anchor, then states whether both are within threshold. It is a coverage check, published.

The chain at a one-month anchor, which is one of the settings used in the earlier article.

The app defaults to a three-month tenor, but you can drag it to one month to see how everything changes. The $4.50 perpetual put marks $0.2105 and funds at 4.7% a month on the strike. I built that same number by hand off the July 27 pull and got roughly $0.29 and 6% a month. I wouldn’t read much into the gap; the old number came out of a spreadsheet with an assumed tenor and a volatility bridge, while this one is a funding-weighted strip read straight off the ladder. Two different methods landing in the same neighborhood is about as much as that comparison is worth.

Turning a view into an optimized position

One of the cool launch features that came with Qwidgets for Prediction Markets was the prediction portfolio optimizer. If you linked a Kalshi account, it allowed you to take a cumulative event (a collection of threshold markets) and define the distribution you wanted to express. It would then model that using a variety of configurable parameters to help you optimize your positions.

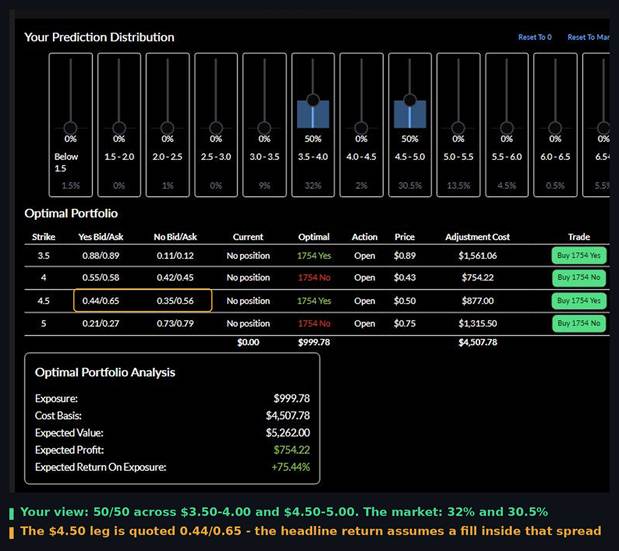
Suppose I ultimately decided that I wanted to trade the bimodal September 2026 scenario outlined above.

Defining a distribution to solve for the optimal binary allocation.

The sliders represent my distribution. Let’s say I took that September split at face value and put half my probability in each of the two live bands. The market has them at roughly 32% and 30.5%. Given a $1,000 exposure budget, the optimizer works out which binary legs express that disagreement most efficiently, and the answer is two band trades: long above $3.50 and short above $4.00 for the lower band, long above $4.50 and short above $5.00 for the upper one.

It reports a healthy expected return on exposure. It also shows, in the same table, that the $4.50 leg is quoted 0.44 by 0.65 and that the number assumes a fill inside that spread based on how I configured the taker/maker pricing slider. That is the same 41-cent market from three sections ago, and it is doing most of the work in the headline figure. Which is the honest answer to whether I would put this trade on: not at the ask, and not without working the order.

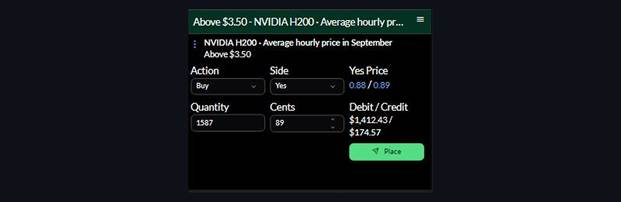
The ticket. Nothing here is a recommendation, and the only tradeable instrument in this entire article is the binary underneath it.

Another neat aspect to the portfolio optimizer is that it runs off live data and integrates your actual positions. If pricing changes and you need to rebalance, it makes suggestions with buttons for adjustment trade tickets. Or if you change your view, just move the sliders to express the new one and the changes get teed up for you.

Summing it up

My earlier article ended with a warning that still stands: being able to price something does not make it profitable. Nothing above is a claim that the equity options playbook translates to compute, and nothing above is a recommendation.

It’s also worth being blunt about what actually exists today. The Kalshi binary ladders are real, live, tradeable markets. The futures, options, perpetuals, and curve are all derived here and not based on external quotes. Multiple exchanges are moving in this space and as compute derivatives are listed I’m very interested to see how real market action compares to what the ladder has been implying all along. I think those instruments will also have a really positive effect on the value of event contracts and may produce the first real hedging scenario that catches on at scale.

Please take a look over at https://predictions.qwidgets.com/compute and let me know what you think. I’m especially interested in whether and how you’d want to see this functionality evolve to support specific trading scenarios.

Of Course Parlay Traders Are Getting Destroyed

But they’re great for entertainment value, if hopelessly losing money entertains you.

On CME’s second-quarter earnings call in July, Terry Duffy said of prediction markets: “I think a lot of these contracts are susceptible to manipulation when they list some of these small parlays and things of that nature, and those are not markets. Those are gambling.”

He didn’t expand on that, and I think most people took it as an offhand comment that parlays (“combos”) are longshots with terrible expected value. But I don’t think it’s that simple. Some people call far out-of-the-money options gambling and, depending on motivation, they have a point. The difference is that any investor can easily understand the relationship between what an option costs and what it pays. Parlays are investor-unfriendly at best, and at worst the deck is stacked in ways the buyer can’t see.

We do have some data. A July preprint looked at 23 million Kalshi moneyline trades and found single contracts priced about right. If you bought in at 70%, you won about 70% of the time. However, seemingly uncorrelated parlays (like a basket of moneylines on different games) consistently had a lower percentage of hitting relative to the purchase price.

This implies that the sum of all market forces drives those single legs towards a fair equilibrium price, whereas the various mechanics at play for parlay traders were overpaying for their eventual return. In other words, if you bought a parlay for two uncorrelated moneylines priced independently at 70% each, you’d assume the fair price of their parlay should be 70% x 70% = 49%. But the data shows that traders are taking offers at 50% or more often enough for the win rate to be notably worse.

There are a lot of factors that come into play here, so let’s walk through some of the key ones.

It’s not a sportsbook, but it’s also not exactly the exchange you’ve been promised

Kalshi is a real exchange with real order books. Parlays don’t use them. Of the combo markets that are open and have actually traded, I found resting depth on fewer than one percent—and never on both sides at once.

The order book is empty

What happens instead is that you request a quote for the parlay you want, and anyone can make you an offer. In practice it’s a very small number of participants who actually respond. It’s nontrivial to quote these because you need to have precise views on event probabilities as well as their interdependencies to provide the mandatory two-sided quote. Plus, it’s all privately transmitted between the requester and the maker. Nobody ever sees the quotes that weren’t accepted, so that whole dataset is lost to the ether and can’t be used for price improvement.

The clock is ticking

And on top of it all, the lifetime of a parlay RFQ is seconds long. That means the maker side needs to be completely automated, so that rules out the vast majority of participants. Further, that ticking clock puts a lot of pressure on the taker to accept the offer before it expires. While it’s generally not a big deal to decline the quote and request a new one, there’s clear psychological pressure to avoid the risk of the quote getting worse. In other words, there’s really no time to seriously evaluate the odds and everyone knows it.

Take it or leave it

Since nothing rests on the combo book, you can’t work an order. There’s no bid/ask/last movement to analyze, and there’s no way to inch from your ideal price towards your bottom line. Price improvement is one of the most basic skills any investor learns early on, but there’s no way to apply it here since you don’t actually participate in the quoting process.

And then there are the fees

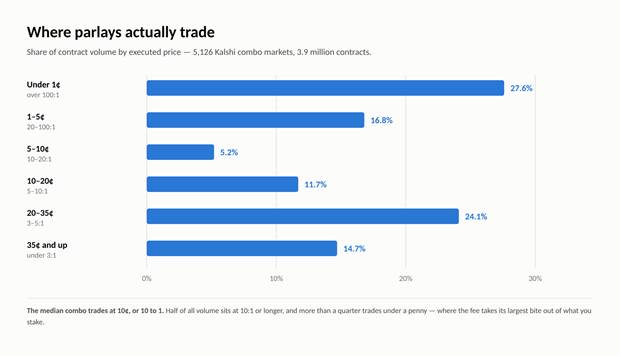
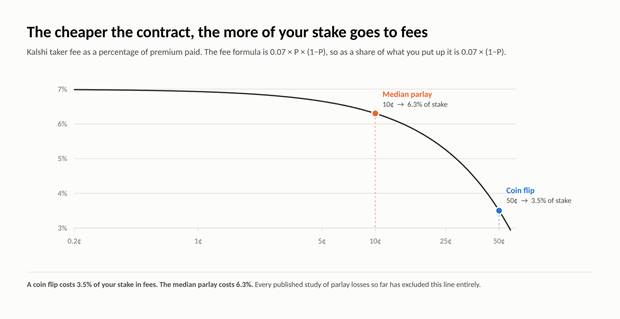
Another critical aspect of the parlay model is that users are always takers, which means that they pay taker fees. At 50 cents, the fee is 3.5% of the invested capital. But parlay odds tend to be longer. When I pulled every Kalshi combo market carrying volume—5,126 markets, 3.9 million contracts—the median trade was 10 cents, where the fee runs 6.3%. That’s $6.30 for every $100 traded on a trade you’re almost surely going to lose.

Where combo volume actually sits. Half of it is at 10 to 1 or longer, and more than a quarter trades under a penny.

The fee as a share of what you stake rises as the contract gets cheaper.

What’s even worse is that every published study of parlay pricing I found seems to exclude fees from their analysis. The most cited one says so outright: “All reported prices are contract execution prices and exclude exchange fees.” Bloomberg’s $294 million combo loss figure carries “excluding fees” in the text. Citizens puts prediction market parlay returns at -18% against -12% on sportsbook parlays, without saying whether that’s gross or net. Just imagine how much worse everyone is actually doing once you factor in the exchange tax.

The quote data is too opaque

Option traders often trade multileg orders. There are a variety of reasons for this, but the key relevance here is that when a multileg order fills, there is a chain of data reporting that updates the last price, volume, and open interest for each of the contracts involved. It’s easy and logical to derive what a given leg’s contribution to the net price was based on the side and ratio. That data is valuable to all participants in making informed trading decisions.

While it may seem tempting to assume the same of parlays, it doesn’t work that way. Parlays are treated as entirely unique contracts and there is no data reporting of their constituent markets. As a result, there could theoretically be a market that millions of contracts are dependent on that never prints a price, volume, or open interest because it was always part of a parlay.

Obviously, market makers quoting them are basing their net prices on specific probabilities, but they’re allowed to keep those numbers to themselves. Part of this could arguably be to protect their internal models. While it’s easy to calculate the odds of independent events happening, there’s an additional layer of dependency data required to accurately quote dependent events in a parlay.

For example, consider an NFL matchup where the Seahawks were favored at 70% and the odds of them scoring over 21.5 points were 70%. If these were independent events, then the parlay odds should be 49%. However, the two events are likely correlated in that the Seahawks are more likely than 70% to win if they score over 21.5 points, so the parlay pricing would be higher, such as 60%. If it was guaranteed that the Seahawks would win if they scored over 21.5 points (like if it were a playoff game tied at 21 in 2OT) then the parlay odds would be 70%—at that point the two legs are the same event wearing different names.

Past two legs, the correlation is unknowable

In the Seahawks example above, the correlation was extractible from a parlay price through simple arithmetic. However, once you get to three or more legs it becomes impossible without more information. Suppose we added in a third leg where Seahawks QB Sam Darnold threw 2 touchdowns. This would surely be positively correlated with both the points and moneyline markets, but how much?

The reality is that it’s not practical to extract this data. Even if you had all the market prices and all the pairs as parlays, you’d still have a hard time being precise about how a given participant would price the three-leg parlay. And it gets even more complicated as the leg count grows.

In defense of makers

Nobody designed this to harvest anyone. Combo makers face real adverse selection and a real capital floor. Every position is fully collateralized with no netting against the legs, so the markup may be compensation rather than extraction. Kalshi pays makers to quote combos rather than taxing them, and several venues are subsidizing combo liquidity at once. In other words, this is an industry-wide structure rather than one venue’s scheme. Kalshi charges a pure commission with no house edge buried in the price, which compares favorably to a sportsbook, where compiled state filings put parlay hold near 20% against roughly 6% on straight bets. And a fair price on a parlay is still negative sum after costs, as is true of essentially every retail derivative.

In listed options we could settle this pretty easily. There’s plenty of literature decomposing a spread into inventory cost, adverse selection, and order processing, and it works because quotes are published and legs print. You can’t do the same here. The buyer can’t tell whether they’re paying for the maker’s real risk or for their own naivety, and neither can anyone else with the full tape in front of them.

Summing it up

Prediction market users are getting slaughtered in parlays and it shouldn’t be a surprise. And it isn’t just the odds. It’s that the price is formed in a private auction with no book, taken rather than worked, off legs that never print, under a dependence assumption nobody publishes, at a fee rate that rises as the contract gets cheaper, and without the data we need to improve the process.

Some of these can’t be easily fixed, but there’s one big step we could take today: publish the RFQ quotes. Delay and anonymize them so they’re not useful as weapons, but share them so the data is out there. It would be a great first step from “parlay gambler” to “combo trader”. What else could exchanges do to support the people trading these?

Post-Earnings Price Level Prediction Markets Are Coming Soon…I Hope

We need an accessible market sentiment alternative to Black-Scholes for earnings jumps.

I’ve been writing a lot about the potential for real crossover between binary prediction markets and traditional vanilla options. It’s mostly been about the emerging AI compute stack, from the options story through the crash it could defuse to a full derivatives stack priced off the ladder. This week I want to take one of the concepts from the AI compute discussion and apply it back to the world of equities: using a binary ladder as a better implied price distribution.

Let’s look at SpaceX, which reports earnings after today’s close for the first time ever. The at-the-money straddle that week runs about $20 on a $114 stock, so it’s pricing a move of ~17% by Friday. This number—the implied move—is quoted everywhere and is the basis for how many people trade the stock and its options.

Before I forget: I’m talking about earnings prediction markets, but I’m not talking about “earnings prediction markets”. Unfortunately, that term has lost all credibility as mention markets for people to gamble on what execs will say during the call. I’m talking about them in terms of a price ladder for the Friday evening immediately after a company’s earnings call.

The key place Black-Scholes breaks

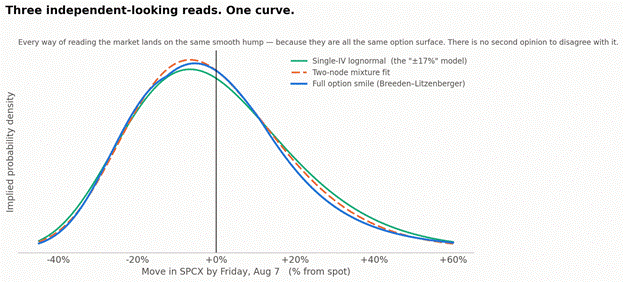
I’m a believer in Black-Scholes, especially for longer-dated options. We need a standard way everyone can generally agree is fair for estimating the expected value of an option at expiration, and BS works well enough to keep the wheels turning. However, it assumes the underlying diffuses in small steps, which isn’t the case around major events like earnings releases. Then it extrapolates with a distribution that peaks at a near-zero move and hands you a fat, ordinary-looking probability of a near-flat finish, on the one night a first-ever print should be anything but ordinary.

Figure 1. Three ways of reading the same option chain, a single-vol lognormal, the full smile, and a two-node mixture, all land on one smooth hump. One surface, no second opinion.

Every way I read this market lands on the same curve. Single-vol model, full smile, a flexible two-node fit, all of them collapse onto one hump, because they are all the same surface. That’s not confirmation; it’s monoculture. Whether the agreed shape is right is a question the market can’t answer today because there is only one instrument and it agrees with itself.

What the single number hides

The Breeden-Litzenberger method enables us to extract a probability distribution from an options chain. It’s not using a model, but rather pricing call spreads to infer the implied probability for each strike range. However, the prices are still fairly tightly bound to the IV-driven model, so they only offer a limited amount of extra wiggle to tease out more specific expectations.

Here’s what the chain is actually pricing for SpaceX’s earnings week the night before.

Figure 2. The option-implied distribution for SpaceX’s Aug 7 weekly, binned like a ladder. Odds of finishing in each $5 band, read from listed call spreads. As of the Aug 3 close, spot $114.53.

This data shows there’s about one chance in five that the stock finishes within 5% of where it started. There’s about two in five that it moves more than the whole $20 straddle. Its up-case centers near +18% and its down-case near −20%, with tails past +38% and −34%. There’s a quiet lean to the downside, 57/43, that the symmetric “+/-17%” cannot express. That shape is the thing traders are actually working with. A single implied volatility (or implied move) number throws almost all of it away.

But let’s actually dig into these numbers. Do you really believe there’s a one-in-five chance this stock barely moves after its first-ever earnings call? How much money would you put behind the scenario where SpaceX, with its 185% IV and $20 implied move, closes within $6 of Monday’s close by the end of its earnings week?

The number’s not wrong. It is what the volatility implies, and you could sell it if you wanted. The trouble is that the only way to fade it today is a complex options structure very few know how to trade, quoted by people all working inside the same framework. So it just sits there, simultaneously unbelievable and uncontested.

Can’t we just use options?

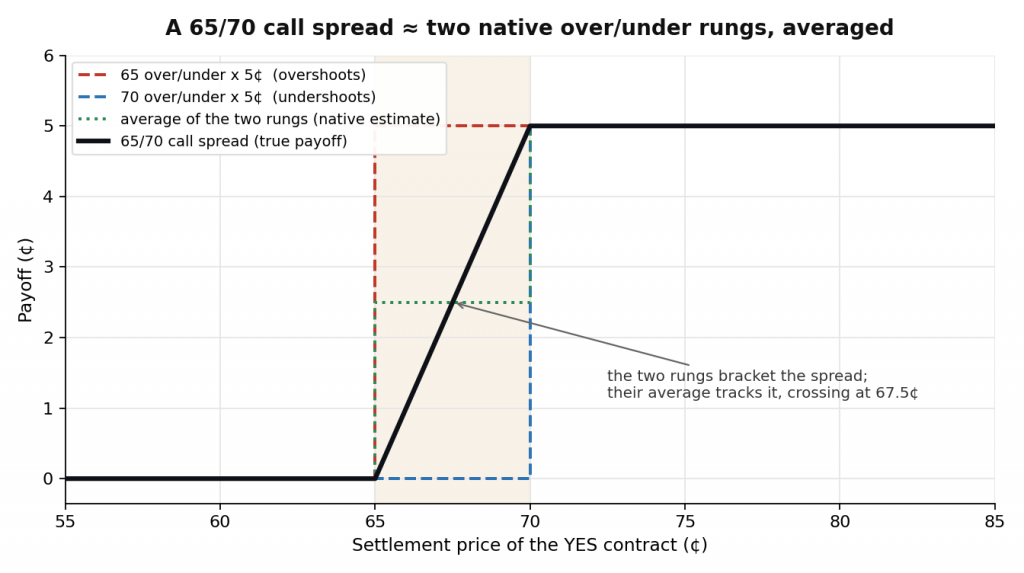
You can already price any band as a tight call-spread or condor. Buy the 109 call, sell the 110, sell the 120, buy the 121, and off Monday’s prices it costs about twenty cents to own the ±5% band. Twenty cents is the probability. The number is already there. What’s missing is a clean, accessible way for more people to trade those bands directly. Advanced shops already run multimodal models; this is about giving the broader market an independent, money-backed view instead of only the IV surface.

An alternative way to express an earnings view

So what would actually break the monoculture? A parallel ladder would give us the first independent measurement. Not a better model of the same prices, but a different crowd putting real money on where the stock lands, quoting the middle directly instead of inheriting it from a curve. If their prices disagree with the surface, that disagreement is information. And because the binary and the option chain live on the same stock, the arbitrage between them drags the surface toward the ladder. It doesn’t just reveal the shape, it disciplines it. The catch is that this only works if the ladder draws its own informed flow. If the depth is purely driven by dealer quotes off the surface then all you have is the same data in a different view.

Cboe has the parts, but…

Cboe already has the building blocks: call spread “prediction markets”, true binary The Plus Zone Minus™, and KPI binaries tied to specific stocks. None of them yet deliver a pure price ladder for individual equities after earnings. All I’m asking for is to combine those pieces so the market can trade the binary odds of finishing in each price band.

There’s no guarantee of success

While these earnings ladders could provide genuine insight into the expected distribution, it’s not without risk. And to be clear, none of this suggests that options are mispriced. The claim is that the shape sits uncontested when there are likely participants who would object if given an easy way to do so.

We still don’t know if there’s real demand for binaries among traditional finance, especially given how closely these instruments map to call spreads. Equity binaries have come and gone before, and the inescapable gravity of sports gambling may have made the class less appealing than it was last time around. Whether the appetite is different now is the open question, and I’ve passed on binary derivatives before for exactly these reasons.

A parallel binary price ladder would give the market its first real second opinion on post-earnings distributions. And the arbitrage between the ladder and the options surface would force that surface to take the disagreement seriously. Would you trade these earnings price ladders? If so, would you use them to replace option strategies or as a complement?

Using Prediction Markets to Price AI Compute Derivatives

Pricing the derivatives in an AI compute stack is easier than it looks.

Two weeks ago I argued that compute finally gave prediction markets something they’d never had. Not a zero-or-one probability, but a real price. Dollars per GPU-hour. That’s the underlying the options playbook always wanted. Last week I laid the instruments out as one stack sitting on the binary ladder with dated and perpetual futures and options. Both times I was talking about what could be built.

This week I want to build it, at least with real numbers. Fortunately, you only have to model a few. The ladder of yes/no markets the exchange already quotes is a full probability distribution. Once you have that, most of the stack prices itself. No Black-Scholes, no volatility input. Let me walk it one number at a time, off a single late-July pull of the Kalshi H200 markets.

The ladder is already a distribution

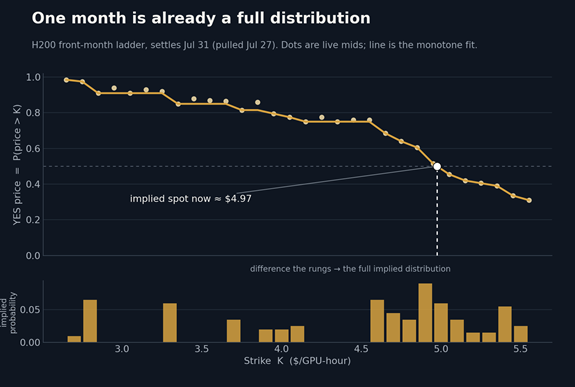
Start with one settlement date. Kalshi lists a ladder of threshold markets on it. Will an H200-hour clear $4.50? $5.00? $5.50? One yes/no contract at each strike. Every dot on the curve is one of those real, tradeable markets, and its price is just the market’s probability. The $5.00 contract trading around 48¢ means the market gives a 48% chance the price finishes above $5.00.

That single column of prices is already everything. Read straight down, it’s the odds of clearing each level. Now subtract the prices of two neighboring strikes to get the range probability. If “$4.50” trades around 70¢ and “$5.00” around 48¢, the chance the price lands between $4.50 and $5.00 is just 70 minus 48, or 22%. Do that for every pair and the column of contract prices becomes a full bar chart of where the market thinks the price will settle. The strike where the odds cross 50% is the implied spot; right now it’s about $4.98.

Why no implied volatility?

The probability distribution is the crux of the whole operation. If you’re familiar with pricing equity options, the bulk of complexity comes from modeling the implied distribution of terminal values of the underlying based on expected/implied volatility and other factors. This skips all of that and allows you to calculate the expected value with simple arithmetic since the market is already giving you distribution ranges.

For the $5.00 call, walk each bar above $5.00 and multiply how likely it is by what the call would pay there. A band around $5.25 pays $0.25, one around $5.75 pays $0.75, and so on. Multiply each payoff by that band’s probability and add them up. A put is the same sum over the bars below the strike. No model. No volatility guess. You’re weighting real payoffs by the market’s own probabilities.

Okay, maybe it’s not quite that simple. First, the bars are coarse. Strikes are listed only every fifty cents or so, so inside a band you’re assuming the price sits in the middle. Also, the ladder ends. It’s possible for the terminal value of the underlying to land way above the highest strike.

Fortunately, the structure of the Kalshi binaries helps us out here. The long-term prediction markets are monthly averages, which is good enough for long-term projection. For the near-term, where granularity means a lot more, we get weekly and monthly ladders that combine for strike widths as narrow as ten cents.

Testing it out with real data

Let’s price some options using data pulled on July 27. I’ll use the next clean weekly settling August 7. I’m skipping the current week’s (July 31) expiration since only a few days are left and its spreads are wide and its upper tail is fat. August 7 has tight quotes and a thin tail, so its average is a tighter, more reliable number. Add that ladder up and the August 7 future comes to about $4.71.

The options use the same ladder. The $5.00 call is the odds-weighted payoff above $5.00, which is about $0.16. The $5.00 put is the same sum over the bars below, about $0.45. The two aren’t independent. The call comes in 29 cents under the put, and that gap is exactly the strike, $5.00, minus the future, $4.71. That’s put-call parity. It’s out of my hands. We get it for free because both prices come from the same distribution.

Dealing with the practical long-term challenges

If we line up every month’s ladder, their centers trace a price curve across time. However, out in the far months the averaging method used above stops behaving because a critical mass of the probability sits above the highest listed strike. You can’t compute it from public prices anymore, so for the curve we’ll switch to the median, which is the 50/50 line. It only needs to know where the middle sits, and the middle is always well inside the quoted strikes.

The shape tells its own story. It isn’t the steep climb you’d expect from a chip that ran up something like 90% in the spring (like the B200). It’s roughly flat, low-to-mid $4s all the way out. What’s dramatic is the band around the line in the chart below. That’s the middle 50% of outcomes, with a 25% chance below its lower edge and 25% above its upper. Even after you throw away the extreme quarter on each end, the middle half still spans two to three dollars a year out. The line is almost irrelevant because the width is the real story. The market is pricing an enormous amount of uncertainty it has no way to offload today. Quick caveat: these far-month books are thin, so read the exact width as directional, not precise.

The one place we need a model

Two perpetual instruments sit on top of all this: the future and its options. The perpetual future is the easy one. It’s continuous exposure to the compute price that never expires and never rolls. Instead of settling, longs and shorts trade a small ongoing funding payment that keeps it tethered to spot. There’s nothing new to price. It tracks the near-dated number, about $4.98, with funding set by what the curve implies about drift.

The perpetual option refresher

Even most experienced options investors haven’t worked with perpetual options, so let’s take a moment to refresh. The most important difference between perpetual options and vanilla options is the nature of the cash flow. They’re more like perpetual futures in that you never actually buy or sell anything. Instead, the options have a market price (mark price) and you put up margin to cover a calculated risk for your long or short position.

Once your position is open, you start paying or receiving a funding payment calculated from the difference between the option’s mark and its underlying theoretical value (index price or payoff). This funding mechanism continuously anchors the trading price to its fair value.

When trading demand drives the option’s price above its theoretical value, the funding rate becomes positive, forcing long position holders to pay short position holders. Conversely, when the option trades at a discount, shorts pay longs. This ongoing exchange of cash flows replaces the traditional expiration date, allowing traders to maintain their options exposure indefinitely without the need to roll over contracts.

Anchoring to a tenor

The perpetual option is the only instrument that won’t price itself as cleanly as the others covered. But you already know the shape of it if you have experience with basic option income strategies. It’s like rolling short puts or the wheel, but on autopilot.

When you deploy a rolling option strategy like the wheel, you select a target time horizon—or anchor tenor—and continually roll expiring contracts to maintain that exposure. A perpetual option automates this concept by synthetically holding a blend of multiple expirations simultaneously. In a perpetual contract, the primary variable is the anchor tenor itself. This defines where the contract effectively sits on the volatility curve, matching the risk profile of a traditional one-month or three-month horizon, for example.

When the anchor is short, the contract behaves like rolling monthlies, where near-term vol drives the position. The mark is cheap and the funding runs fast, similar to the way theta burns when you keep rebuying the front.

When it’s longer, it’s like rolling something dated. Volatility gets more room to play out, so the day-to-day is calmer, and the mark is richer while the funding bleeds slowly.

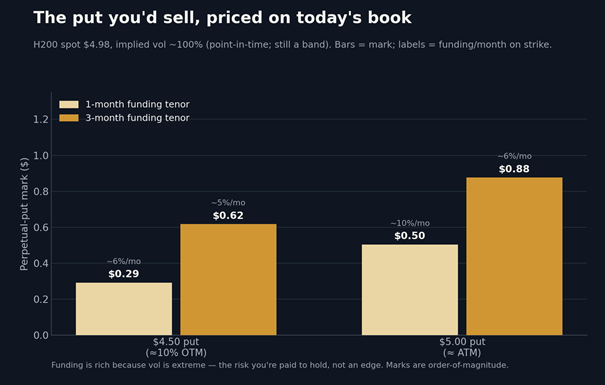
Both are the same position with a different cash-flow profile. Tenor is fixed by whoever lists the contract, so it’s the same for everything across the board. Since these compute perp options don’t exist yet, the chart below illustrates both one-month and three-month versions as examples.

Pricing perpetual options

The funding is the roll. Once you open your position you don’t need to actively manage it. You hold it and pay or receive a steady fee that stands in for the premiums you’d have spent rolling. At the one-month tenor, a $4.50 perpetual put marks around $0.29 and throws off roughly 6% a month on the strike. The exact build is a funding-weighted strip across every tenor, Paradigm’s “everlasting options”.

The whole stack, priced

Let’s step back for a second and walk through a sampling the various instruments covered here.

  • YES for “Will the H200 cost more than $5.00 on August 7?” costs 0.40.
  • NO for “Will the H200 cost more than $5.00 on August 7?” costs 0.60.
  • The August 7 future is 4.71.
  • The August 7 $5.00 call costs 0.16.
  • The August 7 $5.00 put costs 0.45.
  • The perpetual future costs 4.98.
  • The perpetual $5.00 call costs 0.48.
  • The perpetual $5.00 put costs 0.50.

That’s a lot of ways to trade compute for next week.

Summing it up

Besides the obvious reminder that much of what’s been discussed here isn’t even on anyone’s roadmap, I also want to point out that having something be priceable does not ensure it’ll be profitable. This was a fun exercise to get an idea of what these kinds of instruments would cost, but it doesn’t mean the equity options playbook will cleanly translate.

Another important unknown is whether and where the demand will be. Fortunately, demand anywhere in the stack can help drive liquidity everywhere else due to the deeply interdependent nature of the instruments. You could find yourself hedging a multi-leg perp strategy with a combination of long 9-month calls and NO 3-month binary contracts. The flexibility to express these kinds of incredibly precise views doesn’t exist anywhere else.

And, to be realistic, it doesn’t even exist here yet, either. Kalshi is working its way through binaries and perp futures while CME and ICE are working on dated futures and options. Neither has mentioned perp options so far.

And the tooling? Well, that’s a tale for another day…

How Prediction Markets Could Defuse the AI Compute Crash

Kalshi is building a stack of instruments on the price of compute. Completed, it could be a critical layer the AI buildout never had.

Every few weeks someone dusts off that old Cisco chart showing how they were the most valuable company in the world in early 2000 thanks to their role in selling the infrastructure required to build out the internet. Unfortunately, when the demand waned, overcapacity turned into glut and the stock crashed, along with the rest of the market.

I would like to be the first person to suggest there’s a similar story playing out with Nvidia and the AI capacity buildout.

Just kidding. You can’t use the financial internet these days without seeing that story rehashed a dozen times.

But there’s something different this time around. We have something the companies and investors of the 1990s didn’t have: prediction markets.

Reliably pricing demand

In the past, all you could really do was find a way to be on the record that you saw a crash coming. Or, if you had real conviction, you could find a way to profit off of the crash through savvy investments. But neither of those were economically productive in such a way that could help head off the crash and keep the economy stable.

What we really needed—and what we kind of have now—is a way to trade the thing being overbuilt. Not because we want to empower investors to profit off of crashes, but rather to provide a true price discovery mechanism so that the industry involved can optimize their planning to head off the crash to begin with. If the market consensus is that there will be less demand for something—like H200 chips—in twelve months, then that information can be used to inform investments by companies so that they don’t unintentionally drive off the cliff.

I argued in The Options Story for Prediction Markets Just Snapped Into Focus that retail options traders never had a home in prediction markets because binaries don’t provide what they need despite being called “options”. They lack convexity, offer no recovery, and support nothing an income seller can survive a losing trade on. However, Kalshi’s compute curves, plus the perpetual futures (perps) and options coming behind them, can change that. They open the possibility of traditionally dated and/or perpetual puts and calls.

Risk transfer instruments built on information markets

Enabling meaningful risk transfer is the greatest value prediction markets can deliver.

It starts at the information layer, which already exists. Binary threshold ladders—“will a GPU-hour clear $K?” across strikes and tenors—are the market’s implied distribution. String their centers across tenors and you get a forward curve. That’s the threshold-to-distribution-to-curve move I walked through last time, and you can trade those right now. It’s genuine price discovery because it gives capital a way to express views on market demand well ahead of time. It’s also the promise these markets always make about the positive impact they could have on society. But the problem at this layer is that it’s very complex to use and manage while also not providing the efficient instruments major participants want.

This is where the risk transfer layer comes in. Simpler instruments like futures and options provide coverage that neatly maps to the needs most participants have.

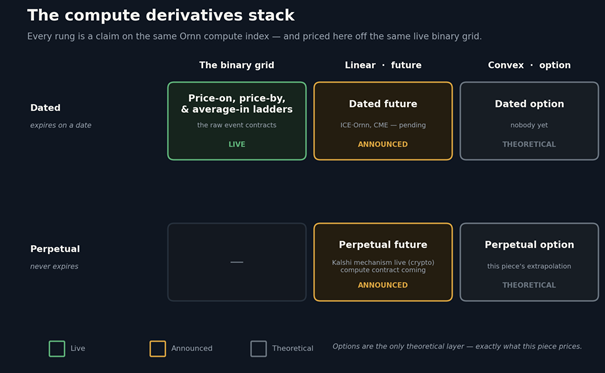
The whole stack in one grid

Futures come first. A perp or a dated future is a linear claim that lets a data center or a lender lock a price and move the risk symmetrically, which is most real-world hedging and does a lot of the work. But a future locks you both ways: you get downside protection at the cost of upside potential.

Options are the second rung, and they add what futures can’t: asymmetry. And a market where protection is sold as a product. Now you can buy a put to floor the downside and keep the upside. Or sell one and you’re running an insurance book. Futures give you a hedging venue and options give you an insurance market.

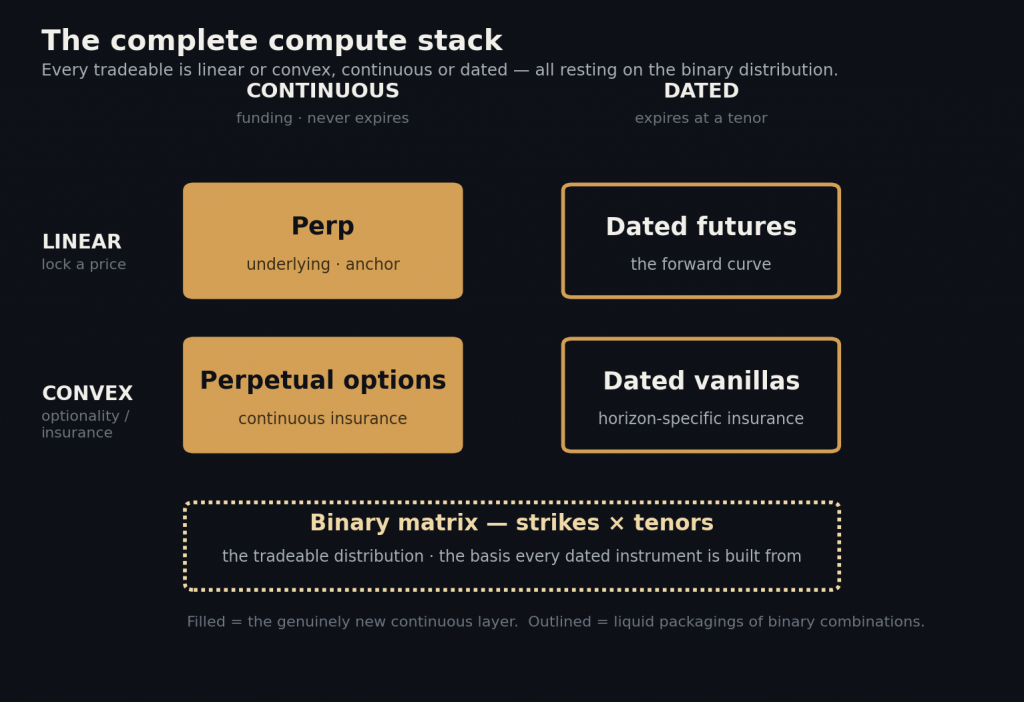
Put the axes together and the whole stack is a clean grid where every instrument is linear or convex, continuous or dated. And it all rests on the binary matrix.

That matrix is the basis. And you could get most of the higher-level coverage through some combination of those binaries. But do you really want to? Why not get the exact exposure you’re looking for and let other players in the stack take on their part of the risk in insuring it?

The genuinely new pieces are the two continuous ones, the perp and the perpetual option, because those aren’t combinations of any single tenor’s rungs. Dated instruments carry the horizon precision while the perpetual ones stay deliberately coarse and deep.

And because every instrument is a function of the same distribution and the same underlying, there are natural synergies.

For the taker, it’s a more precise surface than equity options. Not only do you get a continuous underlying with optionality, but you can also pepper in exposure to discrete events via binaries. I had hoped the equity world would have seen these coming for earnings and rate announcements by now, but there’s no sign of them.

For the maker, that same coherence keeps the diversity from shattering liquidity. Every instrument nets back to the same distribution and the same perp, so a maker hedges one with a basket of the others and quotes both sides more safely than on an equity surface built from sparse strikes. You could participate across the board or specialize based on expertise. I’m eager to start building tools for this space once we know more about exactly what’s coming because I think it would be neat to find optimal ways to balance a book based on this varied arsenal of instruments.

Seeing a crash versus surviving it

We’ll never know how the industry would have handled the dotcom boom if they had this combination of information and instruments available at the time. Would Cisco have locked in a price for the next year of hardware sales? Would hosters have bought capacity in bulk or just hedged near-term needs? Would non-tech companies have invested so heavily in off-brand proprietary tech plays expected to take years to profit? Would startups still have bought Super Bowl ads without explaining what they were actually selling?

The information layer lets you see a glut (or shortage) coming and the risk transfer layer offers the opportunity to survive your exposure. This time, the major players may have what they need before it’s too late.

On the other hand, some might object that this is how 1987 happened. While I’ll concede that there’s some merit there, 1987’s portfolio insurance was toxic because everyone synthesized the same protection by selling into the fall—a real options market instead lets that risk be warehoused by someone who actually wants it. A lot of the impact for this scenario will come down to what sort of leverage is made available. If properly designed, those ultimately taking on the risk will be able to absorb it without causing a failure cascade that takes everyone out with them. I don’t know where that line should be drawn, but I’m sure there’s a reasonable place for it.

Back to modern reality

Pretty much everything I’ve covered here is speculation of what might someday be. None of the convexity has even been discussed by Kalshi as far as I can tell. At this point they just have the binary matrix and forward curves available. Perps are coming, but no ETA just yet. Participants can read some information off the markets, but the books are really thin and I wouldn’t put much faith in the quotes just yet.

The incumbents are moving in too: CME is standing up an AI-compute futures market with Silicon Data and ICE is listing GPU-compute futures settled to Ornn (the same index Kalshi uses). Their arrival is the clearest sign compute is becoming a real derivatives asset class rather than a prediction market curiosity.

The race is on. Who do you think builds the deepest stack first: Kalshi, CME, or ICE? And will it actually change how the AI buildout is financed?

The Options Story for Prediction Markets Just Snapped Into Focus

The roadmap to traditional option strategies on Kalshi may be closer than I dreamed.

I’ve been doing a lot of mental gymnastics to tease out an angle to pitch event contracts to options investors. I feel like this is an audience that needs to be won over for these instruments to have a future.

I know that CBOE has their own flavor of prediction markets, but those weren’t what I was looking for. There are also efforts to deliver vanilla options on specific prediction binaries, but that seemed like a non-starter to me as well.

I even wrote about how the Kalshi American Power Index could enable a specific kind of income strategy in the form of calendar trades. I didn’t love the approach, but it seemed like it could evolve into something.

Then this week Kalshi launched forward curves for GPU compute prices and it all snapped into focus. The curves would be derived from a matrix of threshold markets across a term structure. The same underlying compute price is also getting a forthcoming perpetual futures contract—a perp that tracks spot directly rather than being derived from the curve, and a truly continuous underlying on which options could be struck.

Why binaries were never options

A standalone binary contract is not really an option in the put/call sense. It settles to zero or one. That single fact, more than the absence of Greeks, is why the options playbook never migrated into this space. I have argued before that the Greek apparatus does not port cleanly to binaries because they have no convexity and no recovery.

The most impactful thing to deliver for option traders is probably the most successful retail strategy: the One Man Insurance Company. You sell a put, collect the premium, and roll it. If it goes against you and you get assigned, you end up with real asset at a known basis that can recover. So you write calls against it while you wait and continue to collect premium.

The whole strategy survives its losing trades because the losses are recoverable. Run that same trade on a binary and a loss is total and final. You are not put a recoverable position. You simply lose the notional and it’s over. An insurance company whose every claim is a total loss cannot run a book. That is precisely why prediction markets, for all their elegance, were never a home for income strategies. (And yes, you can pick an underlying that never recovers and ultimately lose on the trade. I mean that YOU can—I obviously never would.)

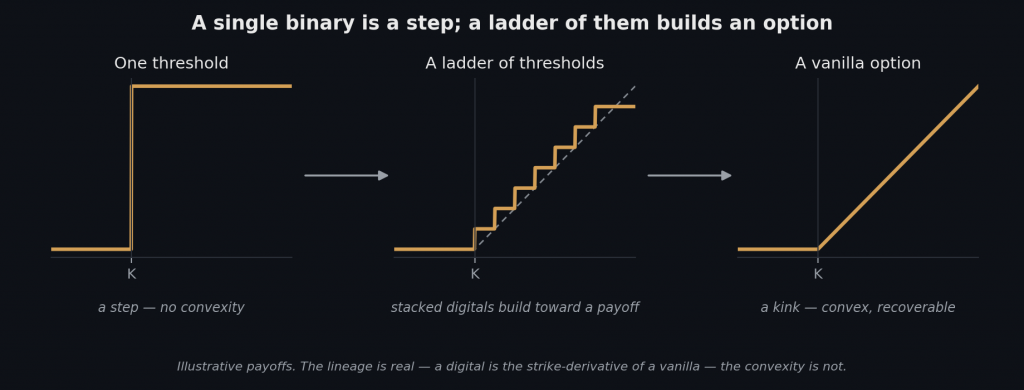
I do want to get pedantic for a second to avoid being sloppy. All of these zero-or-one markets are event contracts. Only some of them are binary options. A contract on a threshold—will a GPU-hour clear $4—is a binary option in the full sense. It’s the strike-derivative of a vanilla, sits on a continuous underlying, and a ladder of them recovers a distribution.

A contract on a categorical outcome—like who wins an election—is a pure event contract with no underlying, no strike, and nothing to inherit from the options world at all. The election is the true dead end. The threshold at least carries the lineage, which is why it gets closer than anything else in this space—and, as we will see, why it still is not enough.

Threshold surfaces don’t quite cross the threshold

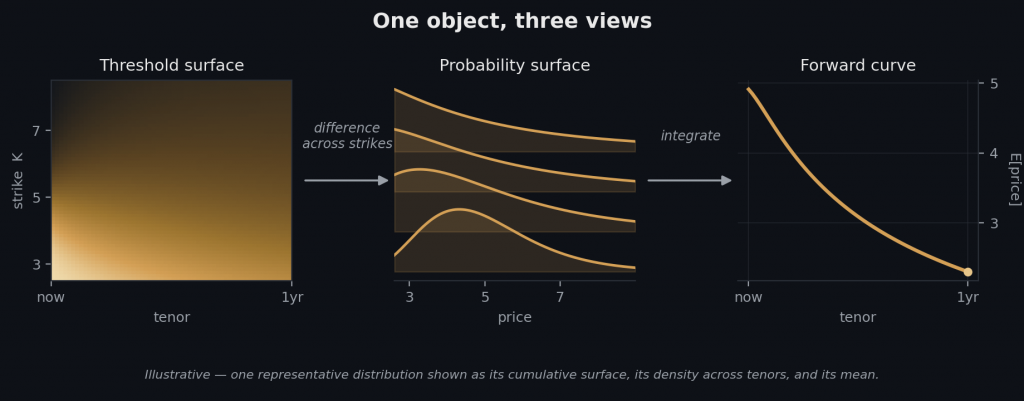
Kalshi’s chip markets are ladders of cumulative threshold markets across many strikes and several tenors. Stack them and you get what I would call a threshold surface—the raw, market-quoted object. This gives you insight into where the market expects prices to exceed over time.

Difference it across strikes and you get the probability surface. These are the implied odds of the price landing in any given range (subtract the odds of $5.50+ from $5.00+).

Integrate that, and you get the forward curve Kalshi just published.

It’s three views of one thing: the market’s full distribution, its density, and its expected value.

It is a genuinely elegant data object, and you can synthesize put-like payoffs out of it. But you inherit the original sin: every threshold in the ladder still settles zero or one, so the synthetic short put is still irrecoverable at the strike. The surface is great for pricing input but poor for writing insurance.

The compute curve rounds out the story

The compute markets settle to the Ornn index: dollars per GPU-hour. That number is unbounded, real-economy, and continuously priced. For the first time, the event contract stack has produced a price—not a probability—as its underlying. That is the piece the American Power Index could never provide: an index bounded between 50D and 50R, it’s still a probability—compressed tails, a pull to the middle, nowhere to run—while a GPU-hour is an unbounded dollar price that behaves the way option math expects. And Kalshi has explicitly said perpetual futures on these metrics are next. Without those perps there would be nothing for market makers to cleanly hedge with, so they’re critical to this all working.

As a quick aside, this sort of industrial metric underlying is very cool. You can’t easily isolate these things for trading today. You could trade Nvidia, but there’s a lot more going on with respect to its pricing, so you’re not getting purity. An industrial-metric perp is a beautiful play, and I suspect compute will be the first of many. I’m eager to see what else gets this treatment.

The options you didn’t know you wanted

If you’re familiar with vanilla options, you already see the potential. But what if we went further? What if the options never expired?

Perpetual options use the same funding mechanism as perpetual futures to provide the same conceptual exposure as term options, but without the management overhead. In a world of $5.00 GPU-hour pricing, you could write a $4.00 put and receive funding payments that are analogous to the roll premium and theta decay you’d get from a rolling put or wheel strategy. You wouldn’t touch the position until you wanted out.

It still carries similar risks, so you would lose money if the underlying dropped too much and persisted for too long. But you’d be in a recoverable position with the option to stick it out like you would with rolling options.

The usual caveats

I should be clear that all of this options talk is speculative. There have been no announcements that I’m aware of and I haven’t seen anything buried in the API that indicates this is being built out. But it seems like a natural step and would bring an engaged and capable source of demand (and likely liquidity) to the underlying prediction market stack.

And even if every instrument I’m describing ships, writing insurance only pays if the underlying actually carries a volatility risk premium worth harvesting. Whether GPU-hour prices do is unproven, and it could compress or even flip against you the moment everyone piles into the same put for income. The plumbing being possible is not the same as the trade being profitable. Regardless, we still don’t know if they will even ship it.

But it sure would be a lot cooler if they did.

Why I’m Passing on Options for Prediction Markets (For Now)

The appeal is real. The opportunity isn’t.

A project called Convallax shipped a testnet recently billing itself as the first options exchange on prediction markets. It lets you trade vanilla options (calls and puts) not against an event’s outcome, but against the implied probability of that outcome—the price of the YES contract—at a range of strikes and terms leading up to settlement. I read the announcement with more than passing interest because it’s something I explored earlier this year and decided not to move on.

This isn’t a takedown—I’d love to see it succeed. But it collides with the same core problem plaguing the entire event contract space: the need for sustained, informed participation beyond short-term sports betting. Or, less cynically, it needs informed investors looking to trade economic markets over the long term. I’ve had a hard time finding these people and am starting to wonder if they’re ever going to emerge.

The appeal of what a robust options market over event contracts could offer is real. Unfortunately, the opportunity itself isn’t.

Selling Real Estate in a Ghost Town

The hardest problem any options exchange faces in this space is that there’s no durable volume to build on. The activity that exists is overwhelmingly short-horizon (sports outcomes resolved in hours or days). That’s real volume, but it’s the wrong kind. An options layer needs an underlying that people hold and care about across weeks and months, not a market that’s created and settled before an option on it could ever season. If you can’t get traders excited about the underlying market in the first place, you won’t get them excited about trading dozens of option series struck against it.

Consider an arbitrary market trading at 50% that settles at year-end. If you offer monthly options around that level for the rest of the year you’ll end up with 90 unique series: 2 (put and call) × 9 (strikes from 30% to 70% in 5% steps) × 5 (expiries July through November). How much volume on the underlying would you need to justify demand across all 90? I don’t think even the 2028 US presidential election outcome has a realistic shot of delivering the meaningful and sustained volume required.

No Yield, No Patient Capital

There’s a structural reason the long-horizon participants an options layer needs are so scarce, and I wrote about it after the Seahawks, of all things, exposed it. When you hold a prediction market position that settles months out, your money is parked. The honest way to value it is against what it would earn risk-free in a Treasury over the same period (let’s say 4.4% today). That opportunity cost is the real breakeven. If the platform pays you no yield on the position, holding it is expensive, and patient capital simply won’t show up.

That’s exactly Polymarket’s situation: it pays interest on only a small, handpicked set of long-term political markets, and nothing on the rest. As a result, most of their long-term markets have very little volume. It’s just people with views so strong they’re willing to eat the price of the contract plus the opportunity cost of carrying.

In addition to the low volume numbers, the lack of institutional liquidity means that these markets can be susceptible to manipulation through very thin order books. This was also covered in the Seahawks article referenced earlier.

How Are You Pricing?

Set demand aside and suppose the participants showed up. Pricing these options isn’t as straightforward as vanillas on underlyings like stocks or indexes.

Equity options control 100 shares each. Here each option is 1:1 with the underlying contract, so the notional is tiny and you need enormous order counts to add up to anything. Worse, with no continuous price process underneath, there’s little to separate adjacent expiries. The tick size starts to become an issue when trying to keep the whole thing liquid and coherent.

Consider a market currently at 50% settling in six months. How do you value the 70% call four months out versus five months out if there’s no expected catalyst in that window? It’s hard to justify pricing them apart by much, and if you try, you’re fighting to keep the term structure monotonic since a longer-dated option must be worth more than a shorter one at the same strike. Thin, model-free quotes drift into exactly that kind of arbitrageable mess.

Underlying Exchanges Have The Ultimate Option

But suppose you solved pricing and proved the demand. It actually gets even worse because an options exchange in this space has no moat against the event contract exchange itself. Anything an entity like Convallax can offer, the underlying venue like Polymarket can mint natively. A ladder of plain over/under contracts—“Will this market finish [month] at or above [strike]?” at each month and strike—spans every call, put, and spread you could write.

Take the cleanest case, a 65/70 call spread. Its entire value is captured by just two native over/unders. It’s worth roughly five cents times the average of the 65 and 70 over/under prices. The two rungs bracket the spread—the 65 pays out a touch too early, the 70 a touch too late—and their average tracks it.

An outright call is slightly more involved because it requires a strip of those over/unders stacked from the strike upward. Either way, every option is a static basket of contracts the exchange can already issue, available with position netting from the account a trader already uses, and spinning up a fresh over/under at any strike or expiry costs the venue essentially nothing. So even in the world where demand exists and pricing is solved, the exposure people want is one the exchange itself supplies more cheaply. And the third-party options layer is left with little value to offer.

To be fair, there are edge cases where vanillas cover specific things the binaries can’t. But is it enough to justify the investment? Is there really a convexity play to be constructed over an underlying outcome settling in six months and averaging a few thousand dollars in volume per day?

Is the Word “Implied” Implied?

One claim I’ll push back on directly is the promise of volatility surfaces for the underlying markets. Most readers will interpret this as implied volatility surfaces extracted from live, two-sided order books in deep markets like equity or index options. A surface that a single firm simply publishes on its own isn’t particularly useful or credible. It needs to reflect real market consensus across strikes and expiries.

And that’s the problem. Convallax doesn’t operate like the continuous quoting environments that produce reliable implied surfaces. Instead, it uses a request-for-quote (RFQ) model: an option is priced only when someone specifically asks for it. There are no resting, continuous bids and offers across the full grid of strikes and expiries. Without that depth and liquidity, there’s simply no organic market data from which a meaningful implied volatility surface can be derived.

I understand the practical reasons for sticking with RFQ—you’d need exactly the broad, standing demand we’ve already established isn’t there yet. But marketing the idea of an implied surface that the current structure can’t realistically produce feels aspirational at best. It’s the kind of overreach that makes me want to re-examine everything else with extra scrutiny.

What It Leaves

I believe the idea of options on event contracts is a nonstarter for the foreseeable future. That’s not because anyone involved is wrong about something technical, but because the foundation isn’t there. No durable demand, no patient capital to create it, no tractable way to price the surface, and no moat even if all three were solved.

This doesn’t mean options on events are a dead idea forever. They just belong where the liquidity already lives—written on underlyings deep and continuous enough to support them (like Cboe with S&P 500 contracts)—not bolted onto thin standalone markets that can’t yet carry their own weight. The appeal was always real. The opportunity may be too, just somewhere else.

Who Is Cboe’s S&P 500 Prediction Market Actually For?

Opportunistic marketing or a path to an event contracts future?

I have, it turns out, been living in The Plus Zone for years without knowing it. That’s Cboe’s name for the sloped middle of a vertical spread—the part that pays out proportionally between the strikes—which I’d always thought of as simply how a spread works. Apparently it’s a feature now, and an admirably well-named one. My hat is off to the marketing wizard to coined that one—I’ve been in your exact situation and recognize your game.

But the branding really does work. I laughed out loud when I read the description, and that made me curious enough to read the actual filings. The deeper I went, the more I kept circling one question. It’s not whether this thing is gambling (the fight the media savors) but rather who it’s actually built for.

Cboe’s own documentation says as much: the verticals are “not a separate product” but rather “standard XSP vertical spread strategies.” So if you buy one, you’ll end up with a call spread in your book. As a result, it also requires options spread approval on your account.

Are prediction markets crossing over already?

Last week, Schwab announced that they would soon be supporting these spread products through a partnership with Cboe. But what really stood out to me was that both they and Cboe position them as “prediction markets.”

I’ve regularly used Schwab as a landmark in my exploration of what it will take to get broad adoption of event contracts in mainstream finance. I’ve made cases about the risk of the toxic term “prediction markets” and the need for consolidated clearing across multiple competing exchanges, plus several other missing pieces I thought were blockers to the new asset class.

But it turns out that I was overthinking it. The missing piece was the humble call spread.

The experienced options traders out there may ask, “if it’s just a 0DTE call spread on XSP with a $1 strike width, can I just trade them on my own today?” The answer is yes. Yes you can.

They’re not exactly what I’d consider “prediction markets,” but I’m also the guy who had no idea about The Plus Zone until the press release came out, so maybe my expertise has reached its limit.

But what if The Plus Zone is too much for me to handle?

Good news—they’ve thought of that, too. Alongside the XSP vertical spread product they’re also going to support a true binary threshold contract. It’s effectively the same as the spread, except that there’s no Plus Zone. I’ve suggested “The Plus Zone Minus” as the official name of this new offering, but I’m pessimistic.

This product is simply a Yes/No contract for questions like “Will XSP close at or above $750?” It’s a little trickier to hedge given the jump payoff, but that’ll get baked into the pricing. Plus, it’s a lot closer to the prediction markets you see on exchanges like Kalshi.

So then who are these markets for?

Let’s work down the list.

  • Not the prediction market audience. People who want a simple yes/no without an options account can’t access them. A fraction of the Kalshi and Polymarket crowd might cross over, but I’m skeptical—the options-approval gate is exactly the friction they came to those platforms to avoid.
  • Not active options traders. Anyone with options approval can trade these same spreads directly, at any width or expiry, and adjust or roll them. The packaged version only removes that flexibility. I’m skeptical they’d ever want the pure binary version.
  • Not hedgers. 0DTE and 1DTE options have very limited utility when it comes to hedging. Outside of the few big macro events like Fed decisions or CPI prints, they’re just not useful.
  • Not position traders. No term structure and dollar-wide zones mean there’s little to build.
  • Not institutions. They already have the full options toolkit.

This really only leaves two groups. The first are users who are able to “prove” their option competence enough to get spread approval but not capable enough to trade them properly.

The second are amateur automated traders. These are the people convinced on Reddit and Discord that they could vibe code bots to skim a spread off “dumb money” that turned out not to be there. Instead, they largely pass contracts back and forth among themselves all day. I won’t comment on what percentage of volume share I think they represent on platforms like Kalshi and Polymarket.

A rung, not a destination

But I have hope for the overall strategy. If you step back, the product looks less like a standalone idea than a step in a sequence. Line the instruments up and each is the previous one with a feature removed:

  • Puts and calls: continuous payoff, a real underlying, an open-ended tail.
  • The Plus Zone (a vertical): cap the tail, producing defined risk and reward with a ramp in between.
  • The “Plus Zone Minus” (a binary): remove the ramp for an all-or-nothing at one strike.
  • Event contracts: remove the numeric underlying entirely, leaving a yes/no on something with no price beneath it, like an election or the weather.

That’s the whole range, from the richest options instrument down to the barest event contract, each step shedding one thing.

To be fair…

None of this makes the product a bad one. The defined-risk structure is real. Your maximum loss is the premium you paid and it’s easy to understand. And if you want a capped, simple entry position on where the S&P closes today, it delivers exactly that. It’s clever, it’s legal, and it’s well-built.

I just don’t think there’s real demand for it. The experienced trader has better tools. The prediction market user can’t easily get in. The hedger and position trader were never the point. But if it’s a means to an end, then maybe it’ll all be worth it.